
Fed Interest rate decision, with policymakers flying blind with the ECB entering the mix next week
The Fed’s interest rate decision is set to occur next week and considering the lack of financial releases as a result of the ongoing US Government shutdown, market participants may face higher volatility than usual following the bank’s interest rate decision and the release of their accompanying statement. Moreover, the majority of market participants are currently anticipating the bank to cut rates by 25 basis points, with FFF currently implying a 96.7% probability for such a scenario to materialize. In our view we would not be surprised to see the bank cutting rates by 25 basis points considering how the labour market has significantly weakened recently. Yet we must stress that the Fed may be flying blind as it was announced that the bank had lost access to labour data provided by the ADP and considering the Government shutdown the Bureau of Labor Statistics has delayed releases, we also would not be surprised to see the Fed policymakers raising concerns over the state of the US economy and the hindrance to conducting appropriate monetary policy decisions should the shutdown continue. Overall, should the bank cut rates it may weigh on the greenback and for the particular pair we will analyse below, the ECB remaining on hold could provide the EUR with an edge over the dollar in the coming week.

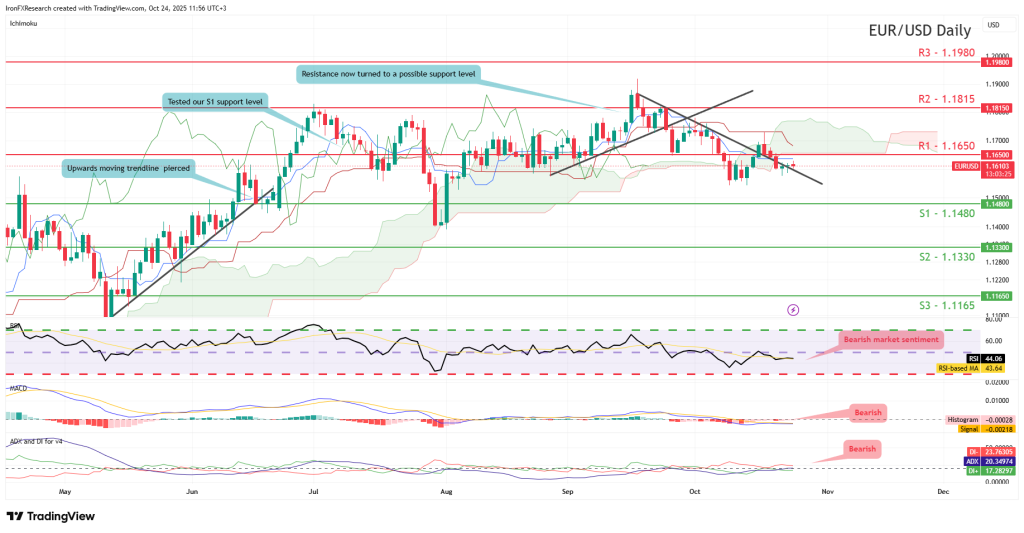
EUR/USD Daily Chart

- Support: 1.1480 (S1), 1.1330 (S2), 1.1165 (S3)
- Resistance: 1.1650 (R1), 1.1815 (R2), 1.1980 (R3)
EUR/USD has dropped below our 1.1650 (R1) resistance level despite temporarily piercing it as we had noted in last week’s edition. Considering the technical’s we would cautiously opt for a sideways bias for the pair as long as it remains between our 1.1480 (S1) support level and 1.1650 (R1) resistance line. On the other hand we would immediately switch our sideways bias in favour of a bullish outlook in the event of a clear break above our 1.1650 (R1) resistance line with the next possible target for the bulls being our 1.1815 (R2) resistance level. Lastly, for a bearish outlook we would require a break below 1.1480 (S1) support line with the next possible target for the bears being our 1.1330 (S2) support level.
Bank of Canada decision next week
Wednesday 29th October
The Bank of Canada’s interest rate decision is due out next week. The majority of market participants are currently anticipating the bank to cut by 25 basis points from 2.50% to 2.25%, with CAD OIS currently implying an 87.4% probability for such a scenario to materialize. Moreover, of interest was the developments earlier on today where “US President Donald Trump said he would immediately halt all trade negotiations with Canada, citing a Canadian advertisement against his signature tariffs plan featuring the voice of former President Ronald Reagan.”, which could lead to heightened trading volatility leading up the bank’s interest rate decision. Nonetheless, should the bank decide to cut rates and imply that they may do so again the future in could weigh on the Loonie.
USD/CAD Daily Chart
- Support: 1.3975 (S1), 1.3890 (S2), 1.3799 (S3)
- Resistance: 1.4085 (R1), 1.4170 (R2), 1.4260 (R3)
USD/CAD appears to be moving in an upwards fashion after testing our 1.3975 (S1) support level. We opt for a bullish outlook for the pair and supporting our case is the RSI and ADX with DI indicators below our chart, yet the MACD tends to cast some doubt on our bullish outlook. Nonetheless, for our bullish outlook to continue we would require a clear break above our 1.4085 (R1) resistance level with the next possible target for the bulls being our 1.4170 (R2) resistance line. On the other hand for a sideways bias we would require the pair to remain confined between our 1.3975 (S1) support level and our 1.14085 (R1) resistance line. Lastly, for a bearish outlook we would require a clear break below our 1.3975 (S1) support level with the next possible target for the bears being our 1.3890 (S2) support line.
XAU/USD H4 Chart
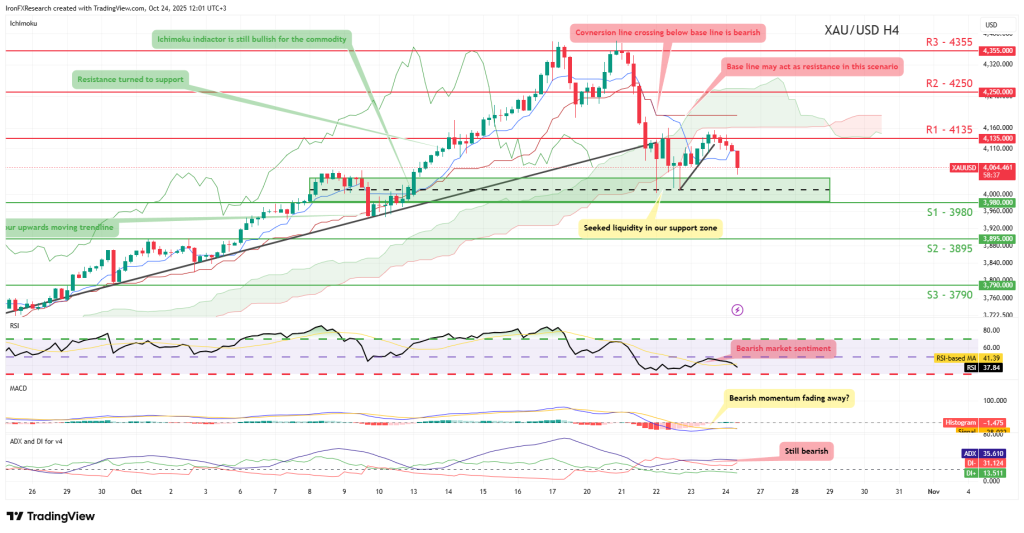
- Support: 3980 (S1), 3895 (S2), 3790 (S3)
- Resistance: 4135 (R1), 4250 (R2), 4355 (R3)
XAU/USD appears to be facing the market correction which we have warned for in our weekly gold outlooks. We opt for a bearish outlook for the commodity and supporting our case are all three indicators below our chart. For our bearish outlook to be maintained we would require a break below our 3980 (S1) support level, with the next possible target for the bears being our 3895 (S2) support line. On the other hand for a sideways bias we would require the commodity’s price to remain confined between our 3980 (S1) support level and our 4135 (R1) resistance line. Lastly, for a bullish outlook we would require a clear break above our 4135 (R1) resistance line with the next possible target for the bulls being our 4250 (R2) resistance level.
WTICash Daily Chart
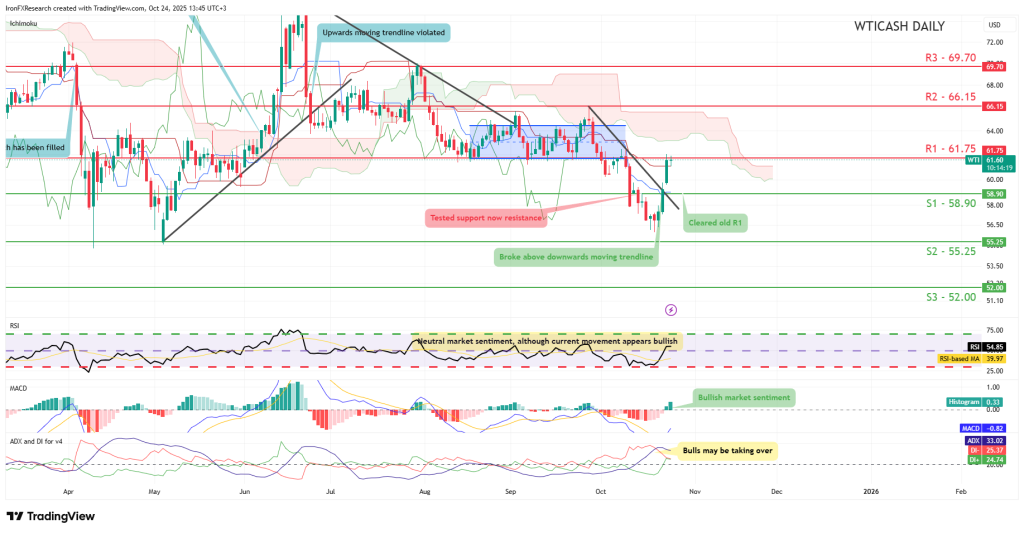
- Support: 58.90 (S1), 55.25 (S2), 52.00 (S3)
- Resistance: 61.75 (R1), 66.15 (R2), 69.70 (R3)
WTICash appears to be moving in an upwards fashion. We opt for a bullish outlook for the commodity and supporting our case is the RSI indicator below our chart which has moved from close to 40 to above 50, implying a shift in the market sentiment, potentially in favour of the bulls. For our bullish outlook to continue we would require a clear break above our 61.75 (R1) resistance line with the next possible target for the bulls being our 66.15 (R2) resistance level. On the other hand, for a sideways bias we would require the commodity’s price to remain confined between our 58.90 (S1) support level and our 61.75 (R1) resistance line. Lastly, for a bearish outlook we would require a clear break below our 58.90 (S1) support level with the next possible target for the bears being our 55.25 (S2) support line.

•Most Trusted Broker — Asia 2025
•Broker of the Year — LATAM 2025
These awards confirm our commitment to building a rewarding trading environment and helping you uncover your potential. Thank you for choosing to trade with an award-winning broker!
Why choose MetaTrader 5 with Top Forex Brokers?
•Blazing-fast execution & enhanced stability
•38 built-in technical indicators & 21 timeframes for precision trading
•Optimized for all devices—desktop, mobile & web
•Trade a wide range of assets: Stocks, Commodities, Forex & more!
Disclaimer: Trading forex and CFDs carries a high level of risk and may not be suitable for all investors. Ensure you understand the risks involved and consider your financial situation before trading.