

US December CPI rates
Tuesday, 13th of January
With December’s US employment report out, we highlight as the next big test for the USD the release of the US CPI rates for December next Tuesday. Should the release show a resilience of inflationary pressures in the US economy, we may see the greenback getting some support while a possible slowdown of the rates could weigh.
USD/JPY Daily Chart
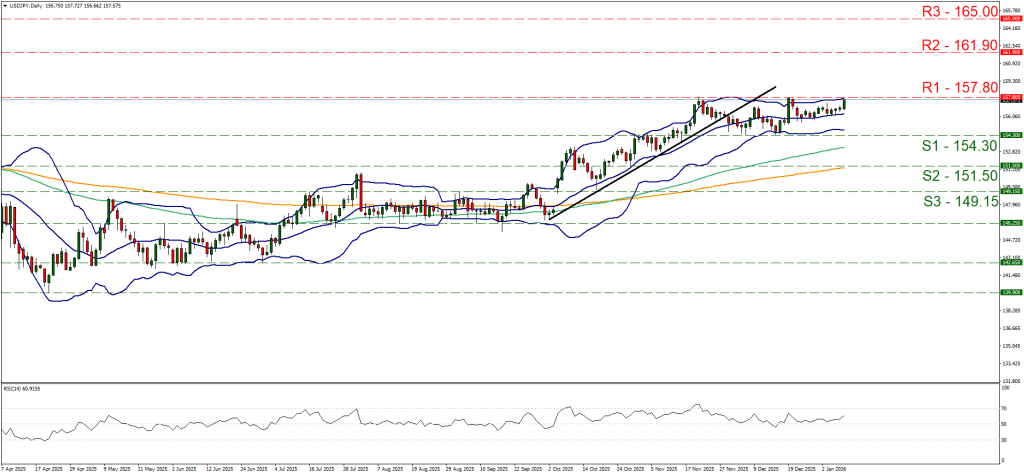
- Support: 154.30 (S1), 151.50 (S2), 149.15 (S3)
- Resistance: 157.80 (R1), 161.90 (R2), 165.00 (R3)
USD/JPY rose today nearing the 157.80 (R1) resistance line for a third time since the 20th of November. For the time being we maintain a bias for a sideways motion of the pair, between the 154.30 (S1) support line and the 157.80 (R1) resistance level, yet bullish tendencies seem to be emerging. For the adoption of a bullish outlook though we would require a clear break of the 157.80 (R1) resistance ceiling and the pair to start aiming for the 161.90 (R2) resistance level. For a bearish outlook to emerge, which we consider currently as remote, we would require USD/JPY to drop, break the 154.30 (S1) support line and start aiming for the 151.50 (S2) support barrier.
UK November GDP rates
Thursday, 15th of January
Next Thursday, we are set to receive UK’s GDP rates for November. Growth for the UK economy is a major issue thus pound traders may focus on the release. Should the rates be in the negatives once again we may see the pound slipping as it would be the third month of contraction of the UK economy.
GBP/USD Daily Chart
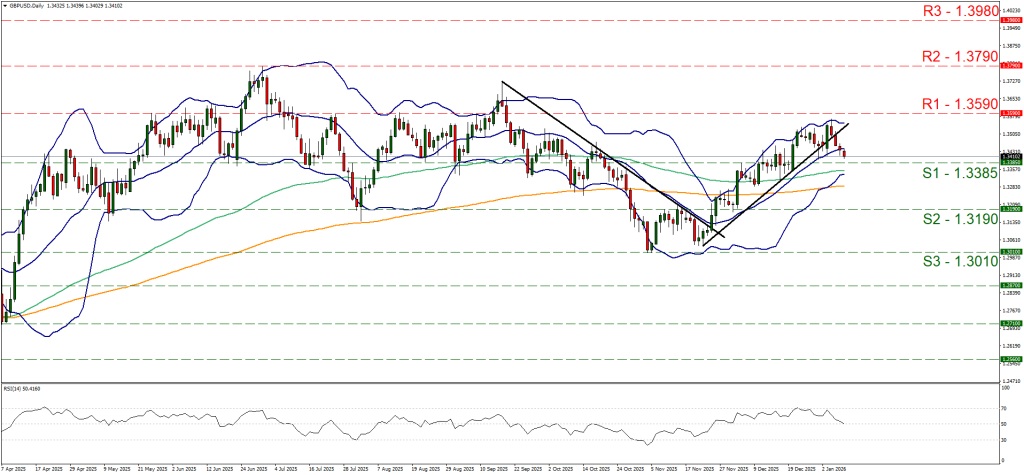
- Support: 1.3385 (S1), 1.3190 (S2), 1.3010 (S3)
- Resistance: 1.3590 (R1), 1.3790 (R2), 1.3980 (R3)
GBP/USD has been dropping since Tuesday and is currently aiming for hte1.3385 (S1) support line. The breaking of the upward trendline guiding the pair since the 21st of November signalled an interruption of cable’s upward motion. The RSI indicator dropped as low as the reading of 50, implying an erasing of the bullish market sentiment and a current indecisiveness about cable’s direction. Should the bulls renew their dominance, we may see the pair breaking the 1.3590 (R1) resistance line, with the next possible target for the bulls being the 1.3790 (R2) resistance level. Should the bears take over, we may see the pair breaking the 1.3385 (S1) support line and start aiming for the 1.3190 (S2) support level.
#APPL Daily Chart
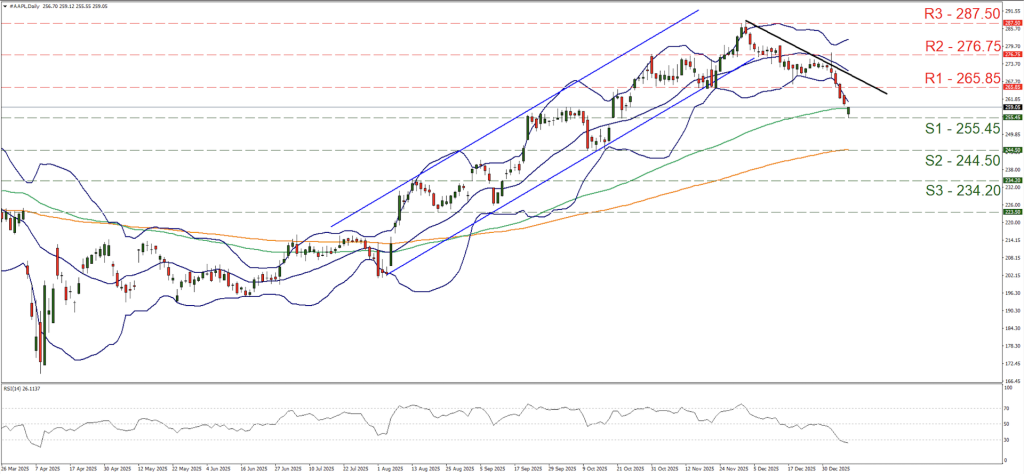
- Support: 255.45 (S1), 244.50 (S2), 234.20 (S3)
- Resistance: 265.85 (R1), 276.75 (R2), 287.50 (R3)
Apple’s share price has been under selling pressure since the end of the 2025 and characteristically has broken the 265.85 (R1) support line, now turned to resistance . We maintain a bearish outlook for the share’s price yet the downward movement seems to be over-stretched. It’s characteristic that the price action has breached the lower Bollinger band which could cause a correction higher for Apple’s share price. Similar signals are coming from the RSI indicator which has reached belo0w the reading of 30, implying on the one hand a strong bearish sentiment yet on the other may imply that Apple’s share price has now reached oversold levels. Should the bears maintain control we may see Apple’s share price breaking the 255.45 (S1) support line and start aiming for the 244.50 (S2) support level.
XAG/USD Daily Chart
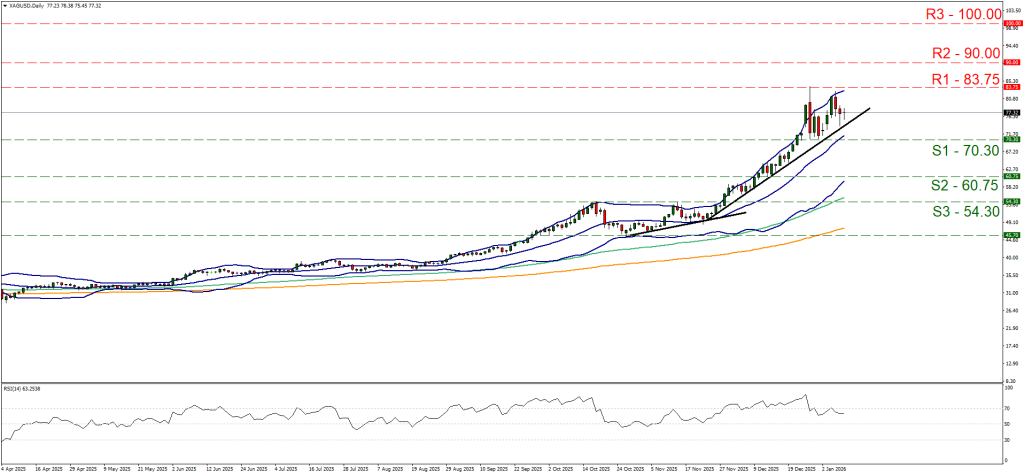
- Support: 70.30 (S1), 60.75 (S2), 54.00 (S3)
- Resistance: 83.75 (R1), 90.00 (R2), 100.00 (R3)
Another chart which we found interesting was silver’s daily chart. The commodity’s price action resembles somewhat the movement of gold’s price, but the dynamics seem to differ. XAG/USD failed to form a new, higher peak after hitting a record high level of 73.75 (R1) on the 29th of December and the main body of the metal’s price action since the 24th of December is confined within the boundaries set by the 70.30 (S1) support line and the 83.75 (R1) resistance line, suggesting a sideways motion. Yet the upward trendline guiding it since the 24th of November, remains intact suggesting a bullish outlook. On the other hand the RSI indicator has dropped below the reading of 70, which currently seems to imply a n easing but still present bullish predisposition of the market for silver’s price. Should the bulls regain the initiative, we may see silver’s price breaking the 83.75 (R1) resistance line, reaching new record high levels, and we set as the next possible target the 90.00 (R2) resistance level. Should the bears take over, we may see silver’s price breaking the prementioned downward trendline signalling officially the interruption of the upward movement and continue to lower to break the 70.30 (S1) support line and start aiming for the 60.75 (S2) support base.

•Most Trusted Broker — Asia 2026
•Broker of the Year — LATAM 2026
These awards confirm our commitment to building a rewarding trading environment and helping you uncover your potential. Thank you for choosing to trade with an award-winning broker!
Why choose MetaTrader 5 with Top Forex Brokers?
•Blazing-fast execution & enhanced stability
•38 built-in technical indicators & 21 timeframes for precision trading
•Optimized for all devices—desktop, mobile & web
•Trade a wide range of assets: Stocks, Commodities, Forex & more!
Disclaimer: Trading forex and CFDs carries a high level of risk and may not be suitable for all investors. Ensure you understand the risks involved and consider your financial situation before trading.