

UK Autumn Budget
Wednesday, 26th of November
The UK’s Autumn Budget is set to be released next Wednesday and could have a severe impact on the sterling in addition to the FTSE100. Specifically, the Labour government tested the waters earlier this month by implying that they may break a manifesto pledge by possibly raising taxes. The ongoing issues faced by the UK Government is a growing debt hole which needs to be addressed and thus the budget will garner heavy interest as the Labour administration lays out their plan to address the UK economy’s shortcomings. Overall should the budget be perceived as a hindrance to economic growth in the UK, the sterling may face bearish pressures.
GBP/USD Daily Chart
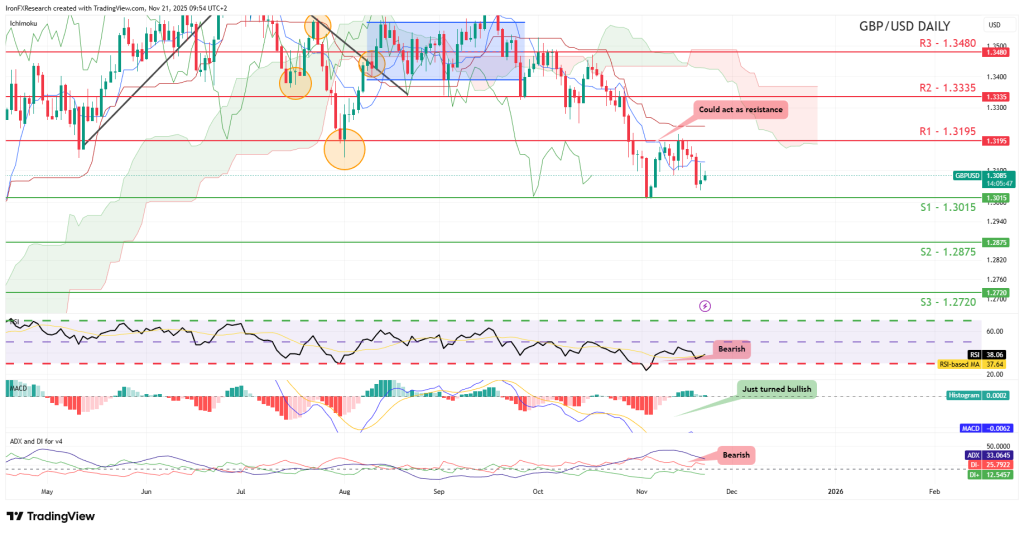
- Support: 1.3015 (S1), 1.2875 (S2), 1.2720 (S3)
- Resistance: 1.3195 (R1), 1.3335 (R2), 1.3480 (R3)
GBP/USD appears to be moving in a sideways fashion after failing to clear our 1.3195 (R1) resistance level, with the pair now also taking aim for our 1.3015 (S1) support line. However, we would opt for a bearish outlook for the pair and supporting our case is the RSI indicator below our chart which currently registers a figure below 40, implying a bearish market sentiment. For our bearish outlook to be maintained we would require a clear break below our 1.3015 (S1) support level with the next possible target for the bears being ourn1.2875 (S2) support line. On the other hand, for a sideways bias we would require the pair to remain confined between our 1.3015 (S1) support level and our 1.3195 (R1) resistance line. Lastly, for a bullish outlook we would require a clear break above our 1.3195 (R1) resistance line with the next possible target for the bulls being our 1.3335 (R2) resistance level.
US PCE rates
Wednesday, 26th of November
The US PCE rates for October are due out next Wednesday and are set to garner significant attention from market participants from around the world. As a reminder the PCE rates are the Fed’s favourite tool for measuring inflationary pressures in the US economy. Moreover, considering that in the Fed’s last meeting minutes, policymakers were concerned about inflation in the US not returning sustainably to the banks 2% inflation target in a timely manner. Hence should the PCE rates showcase an acceleration of inflationary pressures in the US economy it may further increase the markets expectations of the bank remaining on hold in their December meeting, which may aid the greenback. On the other hand, the same opposite scenario may play out should the inflation print showcase easing inflationary pressures in the US economy.
EUR/USD Daily Chart
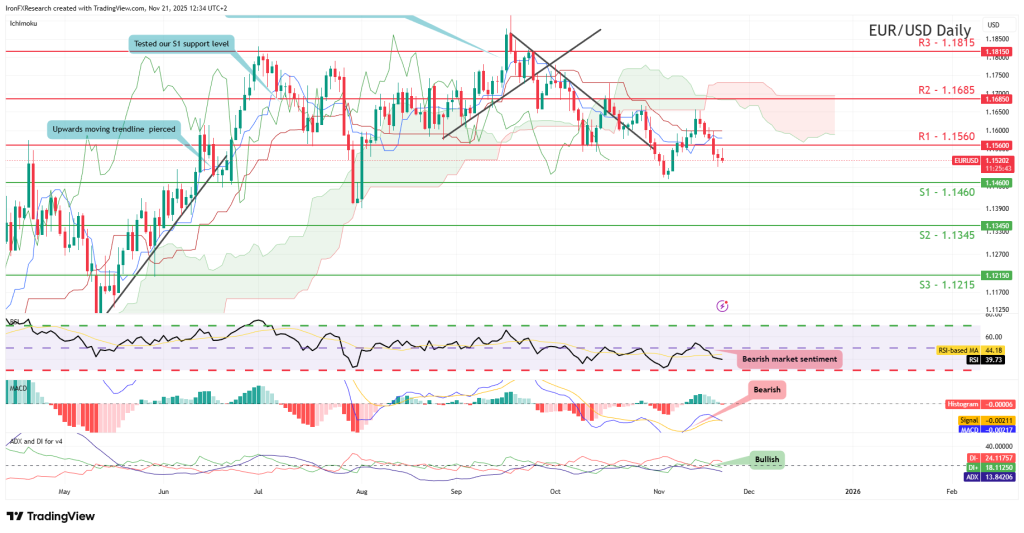
- Support: 1.1460 (S1), 1.1345 (S2), 1.1215 (S3)
- Resistance: 1.1560 (R1), 1.1685 (R2), 1.1815 (R3)
EUR/USD appears to be moving in a downwards fashion after break below our support now turned to resistance at the 1.1560 (R1) level. We opt for a bearish outlook for the pair and supporting our case are all three indicators below our chart which tend to point towards a bearish market sentiment. For our bearish outlook to continue we would require a clear break below our 1.1460 (S1) support level with the next possible target for the bears being our 1.1345 (S2) support line. On the other hand, for a sideways bias we would require the pair to remain confined between our 1.1460 (S1) support level and our 1.1560 (R1) resistance line. Lastly, for a bullish market sentiment, we would require a clear break above our 1.1560 (R1) resistance line with the next possible target for the bulls being our 1.1685 (R2) resistance level.
XAU/USD H4 Chart
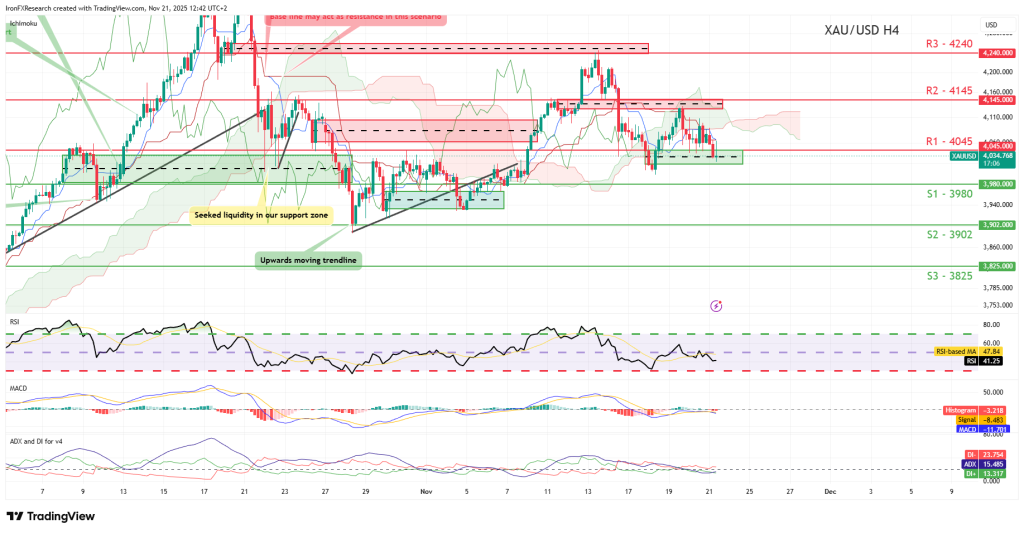
XAU/USD appears to be moving in a downward fashion after clearing our support turned to resistance at the 4045 (R1) level. We opt for a bearish outlook for the commodity’s price and supporting our case are all three indicators below our chart. For our bearish outlook to be maintained we would require a clear break below our 3980 (S1) support level with the next possible target for the bears being our 3902 (S2) support line. On the other hand, for a bullish outlook we would require a clear break above our 4045 (R1) resistance line with the next possible target for the bulls being our 4145 (R2) resistance level. Lastly, for a sideways bias we would require the commodity’s price to remain confined between our 3980 (S1) support level and our 4045 (R1) resistance line.
WTICash Daily Chart
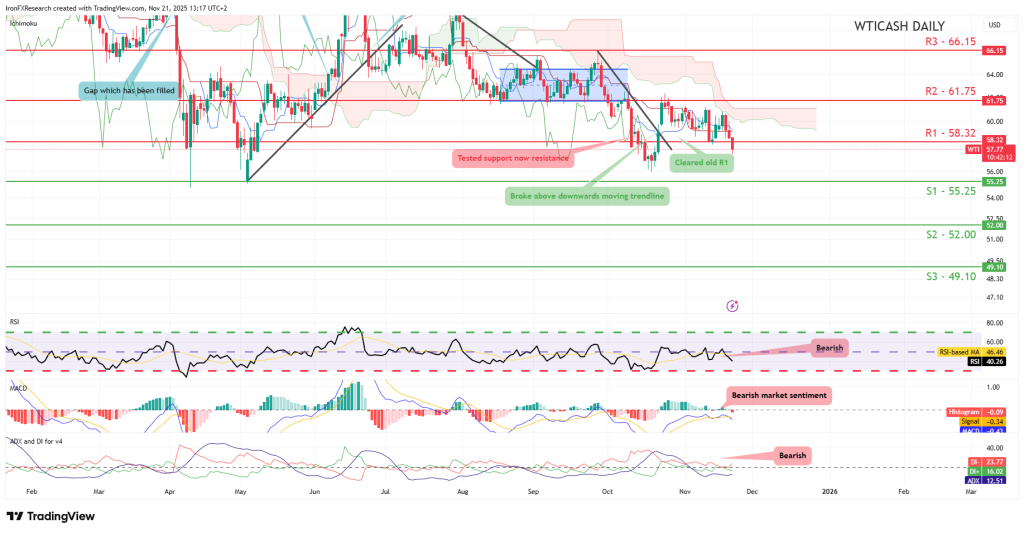
- Support: 55.25 (S1), 52.00 (S2), 49.10 (S3)
- Resistance: 58.32 (R1), 61.75 (R2), 66.15 (R3)
WTICash appears to be moving in a downwards fashion after clearing our support now turned to resistance at the 58.32 (R1) level. We opt for a bearish outlook for the commodity and supporting our case are all three indicators below our chart. For our bearish outlook to continue we would require a break below our 55.25 (S1) support line with the next possible target for the bears being our 52.00 (S2) support level. On the other hand, for a sideways bias we would require the commodity’s price to remain confined between our 55.25 (S1) support level and our 58.32 (R1) resistance line. Lastly, for a bullish outlook we would require a clear break above our 58.32 (R1) resistance line with the next possible target for the bulls being 61.75 (R2) resistance level.

•Most Trusted Broker — Asia 2025
•Broker of the Year — LATAM 2025
These awards confirm our commitment to building a rewarding trading environment and helping you uncover your potential. Thank you for choosing to trade with an award-winning broker!
Why choose MetaTrader 5 with Top Forex Brokers?
•Blazing-fast execution & enhanced stability
•38 built-in technical indicators & 21 timeframes for precision trading
•Optimized for all devices—desktop, mobile & web
•Trade a wide range of assets: Stocks, Commodities, Forex & more!
Disclaimer: Trading forex and CFDs carries a high level of risk and may not be suitable for all investors. Ensure you understand the risks involved and consider your financial situation before trading.